How to turn data into diamonds: the double diamond process
For about four years now Caddle has been creating surveys each and every day for our consumers, giving them the opportunity to earn rewards in exchange for the insights our clients need.
That’s one new survey every day for 365 days out of the year. Each survey itself has 5 questions – that’s 1,825 new questions total. Now multiply that by the amount of responses we get from each survey and my oh my, that’s a heck of a lot of data to sift through!
You may be beginning to wonder how we come up with all these surveys.
Cue the Double Diamond Process. Using this process we’re able to diverge and converge throughout multiple processes and refine a topic into priceless insights you need.
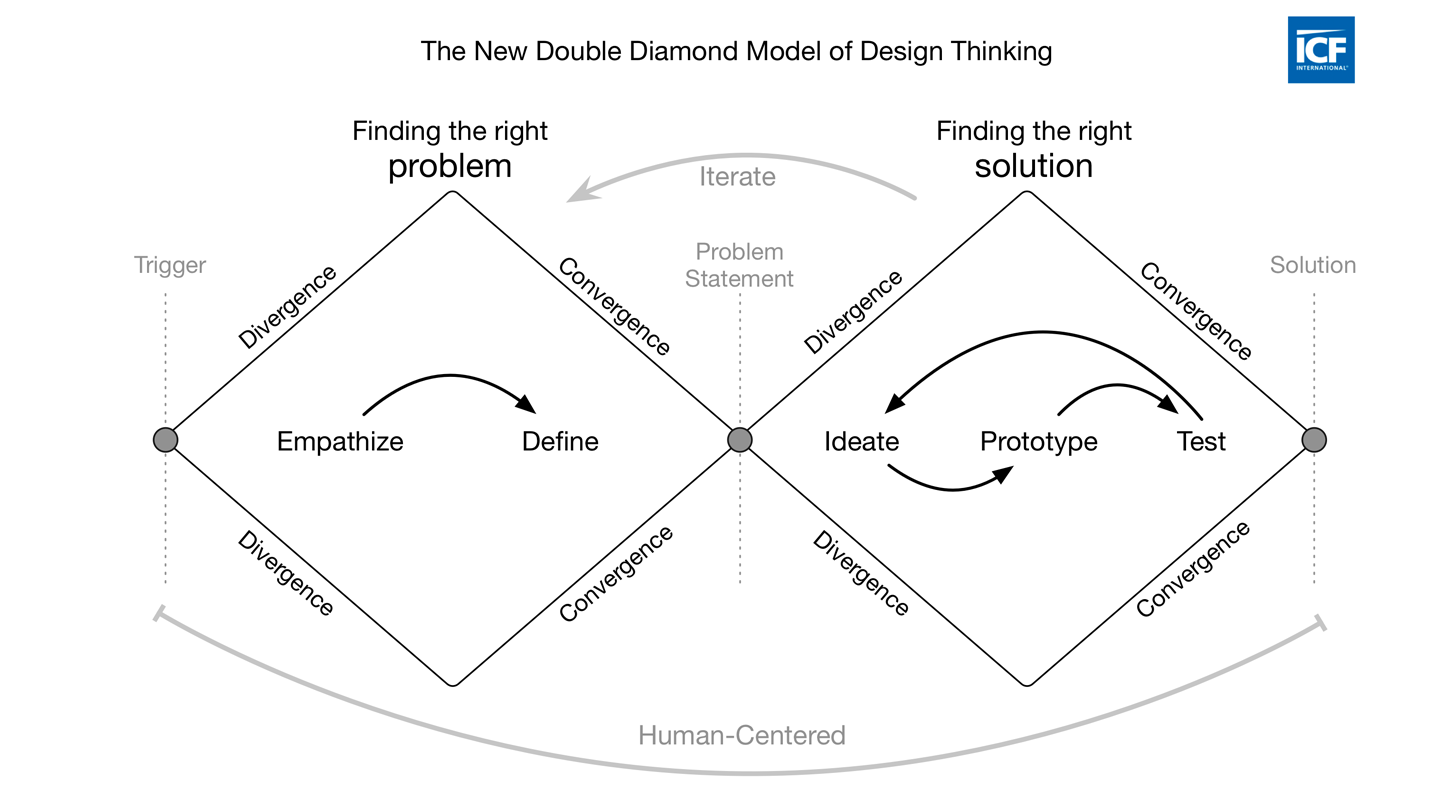
A spin-off from the divergence-convergence model proposed in 1996 by Bela Banathy, the Double Diamond Process was popularized by the British Design Council in 2005. Today, the Daily Survey team at Caddle uses the process from start to finish when creating surveys and collecting valuable insights for industries who need it.
Step 1 – Find a Trigger
By staying up to date via social listening and paying attention to the news, each month the Daily Survey team creates monthly cycles that will help frame topics that will be researched.
For the month of January, one topic we were interested in investigating was new consumer experiences.
Step 2 – Widen your lens on the world
Once we’ve selected a topic from the cycle, we diverge and take a deeper dive. We challenge ourselves to think through all areas which intersect with the trigger.
This can often feel like boiling the ocean, so in order to be efficient with our time, we use the Pomodoro method. This amazing growth hack forces focus, and helps us prioritize what’s most important. Here’s how it work
- Each team member chooses a topic to explore
- Moderator sets timer for 25 mins
- Each team member goes through four, uninterrupted 25-minute cycles of research and brainstorming to come up with topics of interest.
- Between work sprints, the moderator asks the team some open-ended questions about their work and looks to further expand thinking.
Step 3 – Daily survey creation
Once the team has curated a surplus of topics and questions, it is over to our question sorter to build out our research schedule. During this stage, questions are grouped into 5 question surveys, which provide a unique lens on a current issue.
For the new experiences cycle, DIY culture was one of the areas we focused on, as we had a hunch that DIY experiences were on the decline with consumers.
Step 4 – Find the pain
This is when the Daily Survey team breaks out their bets. The team discusses the survey questions and begins hypothesizing on what the data will answer to our questions.
Is it a dying culture? What experiences and emotions do people most associate with DIY culture? These were all questions we were going to ask and get answers to.
Step 5 – Data collection
Once the surveys have been finalized, they go live on our platform where members answer the survey and receive a cash reward in exchange for the data they’ve so graciously provided us.
The data science team then neatly compacts the data into a data mining report that can be easily used to break down the survey responses by gender, age, demographic, and any other filters we might find useful.
Step 6 – Show me the insights!
These reports are then handed off to the marketing team where they begin a charting process, highlighting the most interesting insights that tell a story about the DIY consumer experiences.
In this instance, insights suggested that DIY culture is ripe for disruption in the self-care industry.
Step 7 – We have a few more questions…
The marketing team then conducts further research on the particular industry to determine why DIY culture has the potential to disrupt the self-care industry.
These findings, in relation to the insights we gathered are then curated into marketing content that is shared on our blog for industry experts to learn more about.
Step 8 – Review our report card
We look for a couple of things when investigating success and failure. In order to identify insight paths for new products, we tend to look for 40% or more of responses aligned on interest.
When evaluating disruption in the product life cycle, we align our thinking with Growth Hacking expert, Sean Ellis, author of the bestselling “Hacking Growth”. Sean has popularized the idea of product-market fit, which has a lot of value as you decide your priorities using this funnel. Sean has often said that if at least 40% of your existing users wouldn’t be “very disappointed” if your product disappeared then you don’t yet have product-market fit.
Often there isn’t a clear solution to the insights we’ve found. But that’s okay, Caddle loves when this happens! That means that we get to probe the subject even further and continue the double-diamond process.
To delve deeper into a topic, we’ll propose new questions that we’ll ask in upcoming surveys to draw further conclusions. We’ll also reach out to the reader who may have a particular question about the insights we’ve gathered and include it in our survey research.
You can follow our double-diamond process by checking out the blog we wrote about the DIY culture and its potential to disrupt the self-care industry.
If you’d like to follow this DIY journey, make sure to keep up to date with our blog. Similarly, if you have questions about your industry that you want answered, make sure to reach out to us!